The Principal/Owner dashboards provide visibility into the overall health and performance of your business. They are designed to give you insight into your business at a strategic level and explore the underlying details, helping you make more informed decisions to strengthen and grow your business.
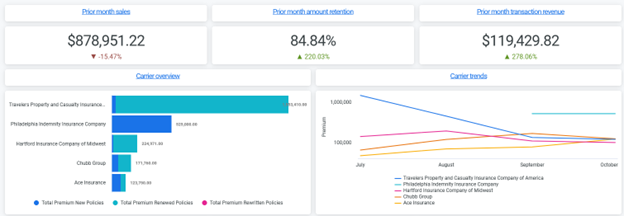
This quick view answers key business questions about your active book, revenue retention, top carriers, and 90-day sales information. The Pulse dashboard also links to the following additional dashboards:
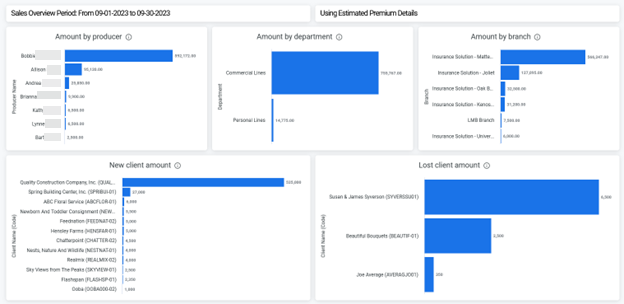
The Sales Overview dashboard uses Policy Detail data to provide views of new business. Breakdowns include new sales by producer, department, and branch; largest new clients; and largest lost clients.
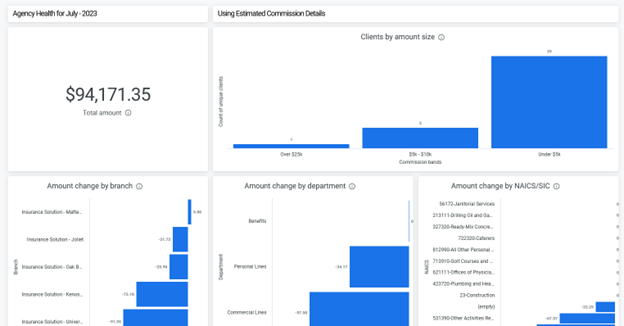
The Agency Health dashboard uses Policy Detail data to display changes in your agency’s book. You can monitor retention and changes in revenue or premium by branch, department, and industry code. It also displays client count by revenue/premium bands and your agency’s active book value.
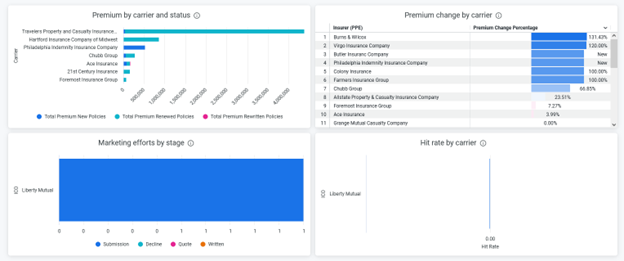
The Carrier Overview dashboard uses Policy Detail and Policy Marketing data to provide views of carrier relationships. You can explore breakdowns by carrier of new, renewed, and rewritten premium; changes in premium; marketing efforts; and hit ratios.
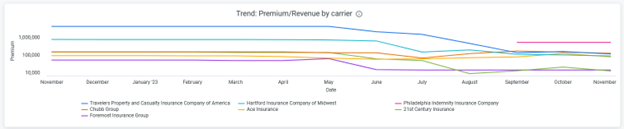
The Carrier Trends dashboard uses Policy Detail and Policy Marketing data to display carrier-level changes in premium and hit rate over time.
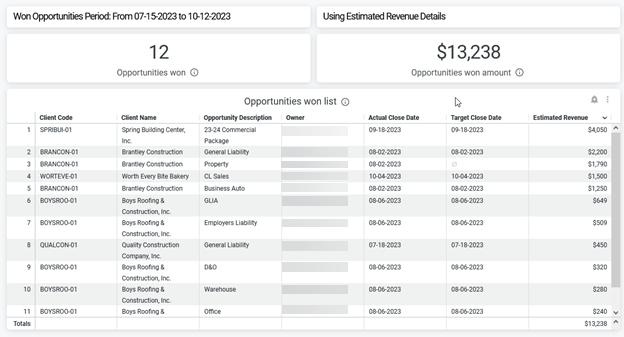
The Won Opportunities dashboard uses data from the Opportunities area to display the count and monetary value of opportunities won in a specific time period, with a list of Client, Opportunity Owner, Close Date, and Premium/Revenue details.
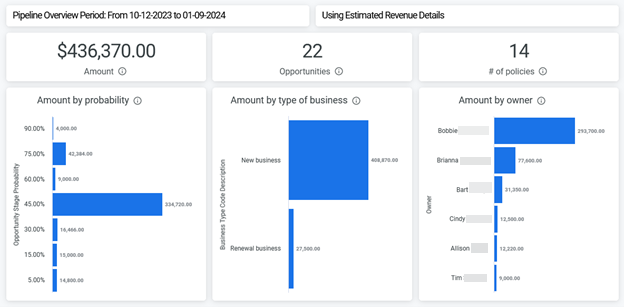
The Opportunity Pipeline dashboard uses data from the Opportunities area to display the monetary value, client count, and policy count of open opportunities in the pipeline for the selected time period. It also breaks down the pipeline by Stage Probability, New vs Renewal, and Owner.
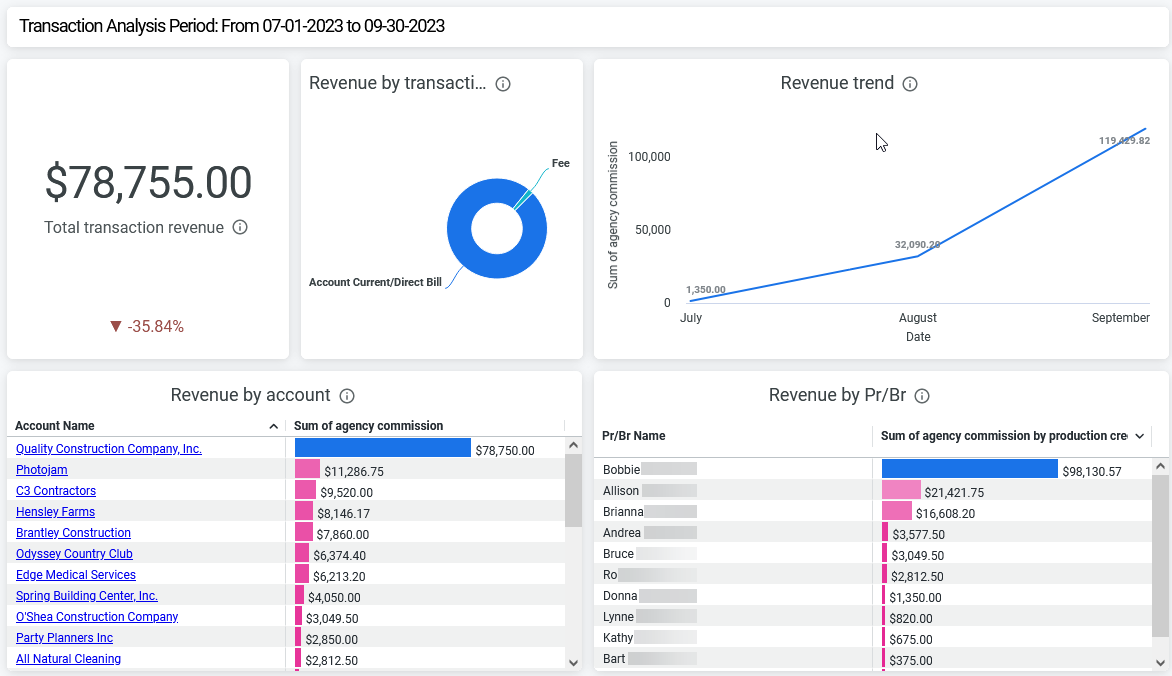
The Transaction Analysis dashboard answers questions about revenue using data from the Transactions area. View total transaction revenue and the revenue trend for your selected time period, as well as a breakdown of those transactions by transaction class. You can also view breakdowns of transaction revenue by account, Pr/Br, Policy Type, PPE (if applicable), and structure.
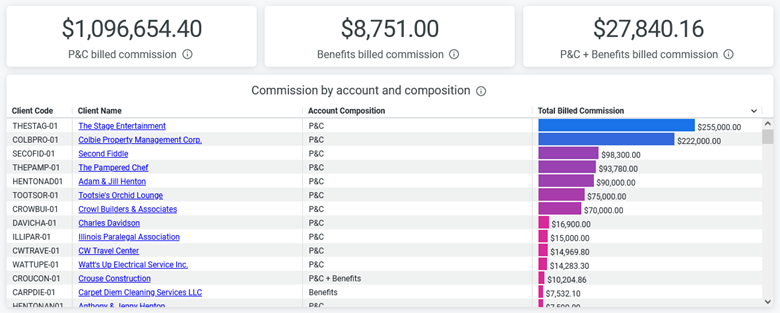
The Commission by Type of Business dashboard gives you a new, powerful way to look at the composition of your book of business and identify cross-sell opportunities. The dashboard categorizes all clients with active policies into one of three mutually exclusive buckets: P&C (clients with only P&C policies), Benefits (clients with only benefits policies), and P&C + Benefits (clients with a mix of both). The dashboard displays the total commission for each bucket and the commission and bucket for each client.