These dashboards give you visibility into your sales team’s workload and performance to help you hit your targets and win more business.
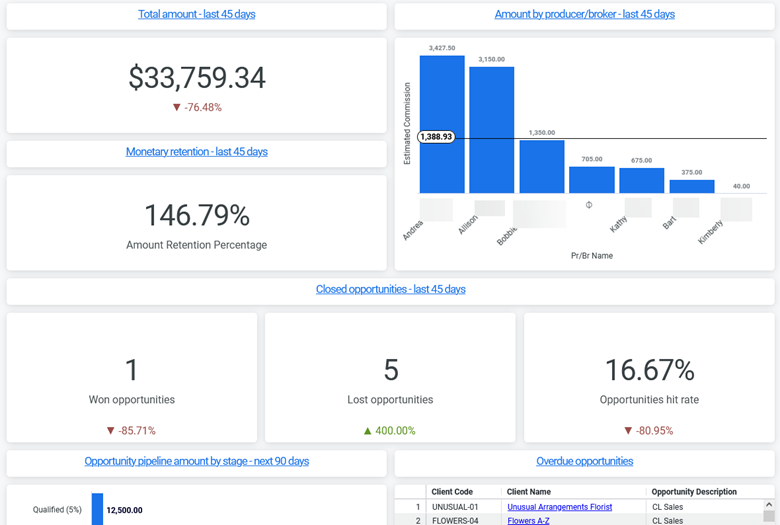
This quick view answers key business questions, including your total sales in the last 45 days and a breakdown by Producer/Broker. This dashboard also provides insight into monetary retention, recently won opportunities, the number of opportunities in each stage in your pipeline, and overdue opportunities. The Pulse dashboard also links to the following additional dashboards:
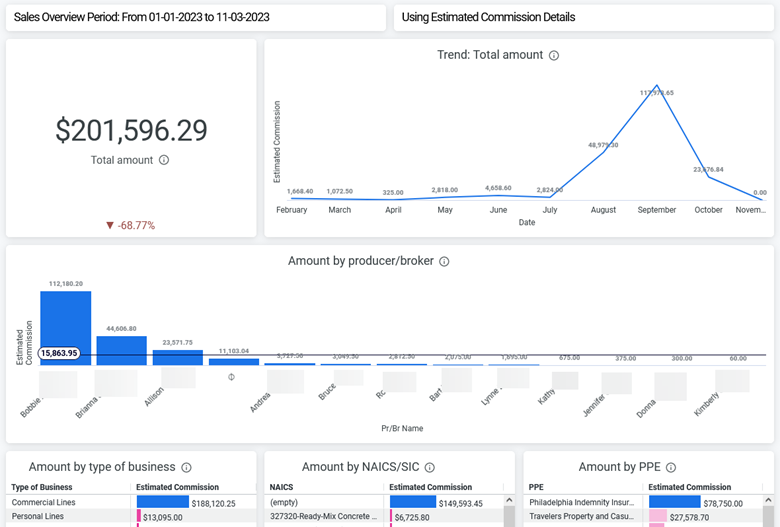
View your total recent sales and sales trend and compare your total sales against sales goals using Policy Detail and Sales Target information. You can also view the sales amount broken down by producer/broker, type of business, NAICS/SIC, and PPE.
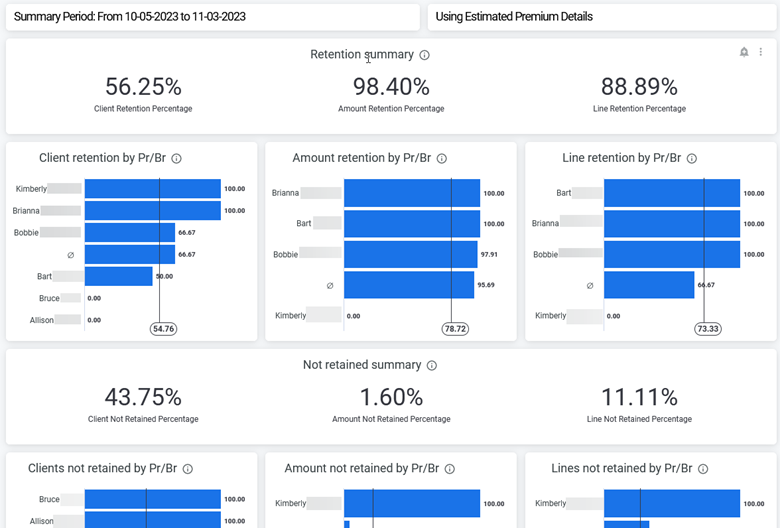
This dashboard displays the percentage of clients, monetary amount, and lines retained and not retained. You can also view breakdowns by Producer/Broker.
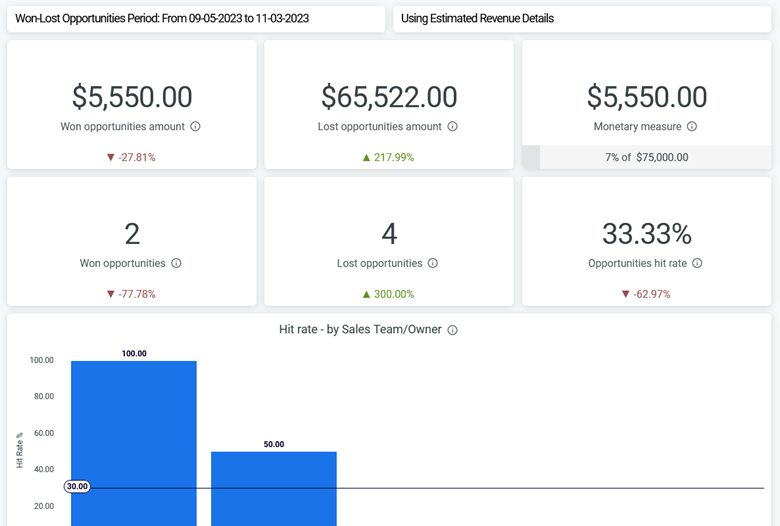
The Won-Lost Opportunities dashboard displays the amount and count of won and lost opportunities and measures the monetary value of won opportunities against your sales targets. It also displays the hit rate, with a breakdown by Sales Team/Owner, and lost opportunities, with breakdowns by loss reason and stage.
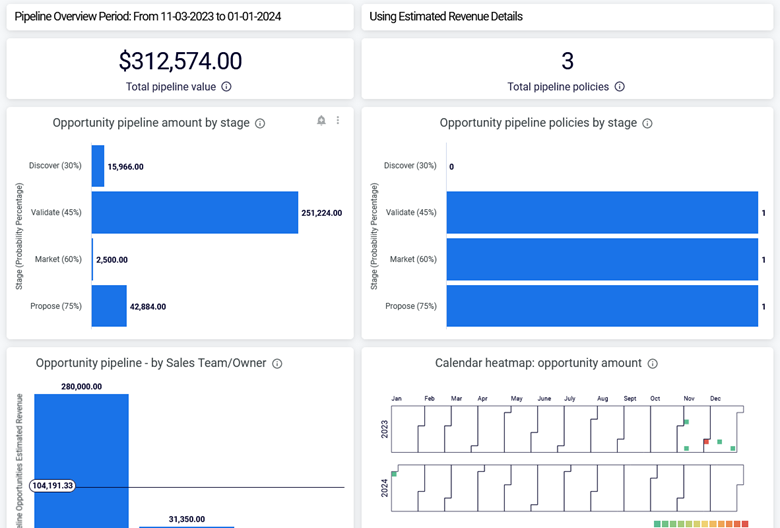
The Opportunity Pipeline Overview dashboard displays your sales pipeline using data from the Opportunities area. This dashboard shows the value and count of policies for the selected time period, plus breakdowns by Stage Probability and Sales Team/Owner. The Calendar heatmap displays the opportunity amount by day based on each opportunity’s targeted close date.
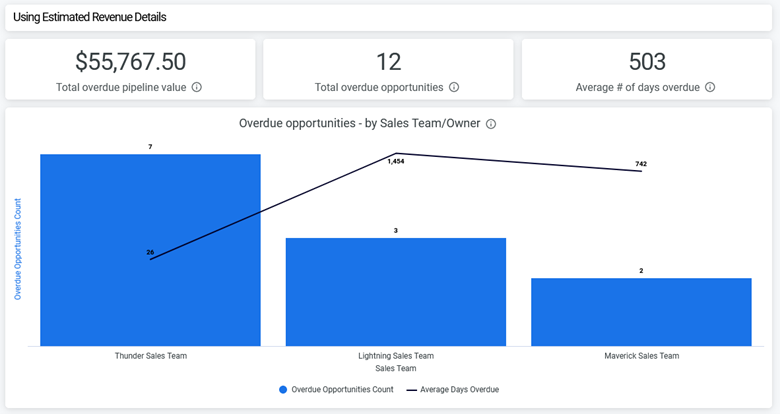
The Overdue Opportunities dashboard provides insight into the total overdue pipeline value, total overdue opportunities, and the average number of days overdue. You can also view the overdue opportunity count and the average number of days overdue broken down by Sales Team or Owner.
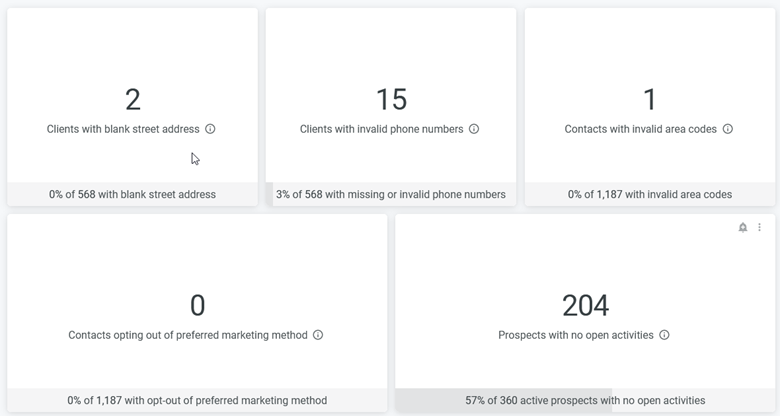
The Data Quality dashboard identifies clients with no street address entered or with an invalid phone number or area code, contacts who have opted out of their Preferred marketing method, and Prospective clients with no open activities. Your team can then resolve these issues to communicate more effectively with these clients.